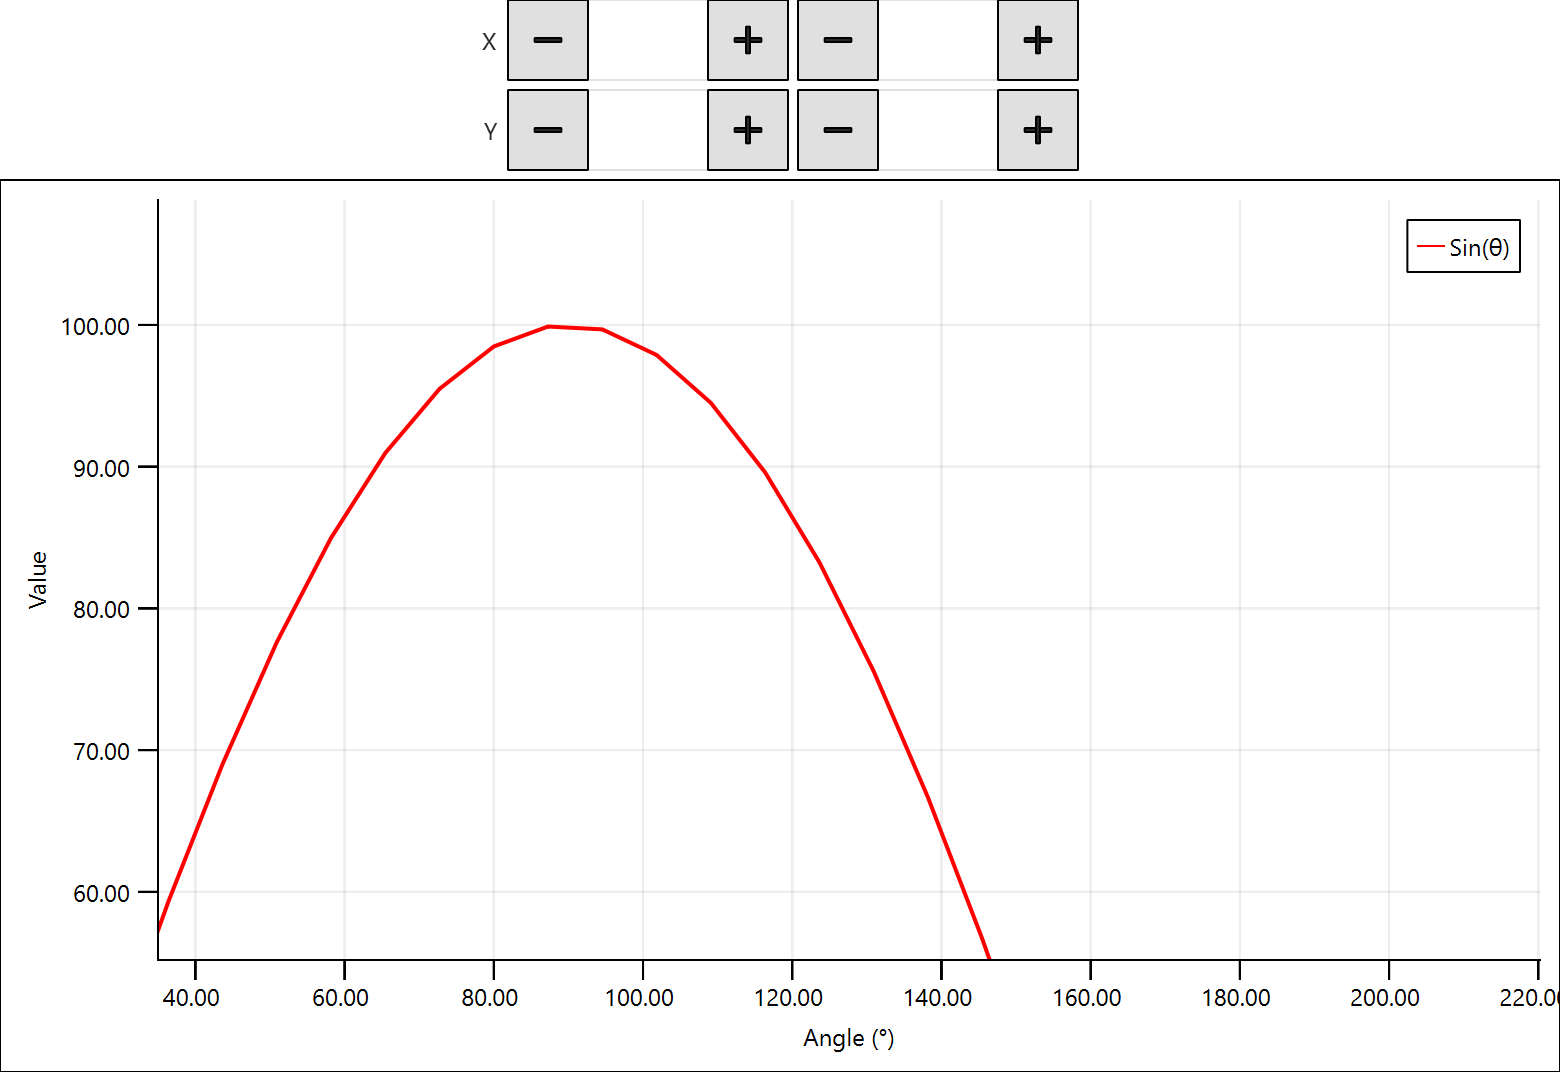
Zoomable axes
Zooming adjusts the axes' limits.

This example demonstrates using a ZoomPanHandler to handle conversion of user inputs to a transformation. This transformation is then applied to the view rect of the graph, so that the axes limits changed based on user input.
In addition, the limits are displayed in a set of SpinBoxes, and any changes to the spin box values are fed back into the ZoomPanHandler using the baseTransformFromRect method to convert the limits back into a transformation.
To zoom into the entire graph instead, see the Zoomable as image example.
 // SPDX-FileCopyrightText: Copyright (c) 2024 Refeyn Ltd and other QuickGraphLib contributors
 // SPDX-License-Identifier: MIT

 import QtQuick
 import QtQuick.Layouts as QQL
 import QtQuick.Controls as QQC
 import QuickGraphLib as QuickGraphLib
 import QuickGraphLib.GraphItems as QGLGraphItems
 import QuickGraphLib.PreFabs as QGLPreFabs

 Item {
     id: root

     function _setLimits() {
         let r = Qt.rect(xMinSpin.value, yMinSpin.value, xMaxSpin.value - xMinSpin.value, yMaxSpin.value - yMinSpin.value);
         pinchArea.baseTransform = axes.grapharea.baseTransformFromRect(r);
     }

     QQL.ColumnLayout {
         anchors.fill: parent

         QQL.RowLayout {
             Item {
                 QQL.Layout.fillWidth: true
             }
             QQC.Label {
                 text: "X"
             }
             QQC.SpinBox {
                 id: xMinSpin

                 editable: true
                 from: axes.viewRect.x
                 to: xMaxSpin.value - axes.viewRect.width / pinchArea.maxScale.width
                 value: Math.round(axes.grapharea.effectiveViewRect.x)

                 onValueModified: root._setLimits()
             }
             QQC.SpinBox {
                 id: xMaxSpin

                 editable: true
                 from: xMinSpin.value + axes.viewRect.width / pinchArea.maxScale.width
                 to: axes.viewRect.x + axes.viewRect.width
                 value: Math.round(axes.grapharea.effectiveViewRect.x + axes.grapharea.effectiveViewRect.width)

                 onValueModified: root._setLimits()
             }
             Item {
                 QQL.Layout.fillWidth: true
             }
         }
         QQL.RowLayout {
             Item {
                 QQL.Layout.fillWidth: true
             }
             QQC.Label {
                 text: "Y"
             }
             QQC.SpinBox {
                 id: yMinSpin

                 editable: true
                 from: axes.viewRect.y
                 to: yMaxSpin.value - axes.viewRect.height / pinchArea.maxScale.height
                 value: Math.round(axes.grapharea.effectiveViewRect.y)

                 onValueModified: root._setLimits()
             }
             QQC.SpinBox {
                 id: yMaxSpin

                 editable: true
                 from: yMinSpin.value + axes.viewRect.height / pinchArea.maxScale.height
                 to: axes.viewRect.y + axes.viewRect.height
                 value: Math.round(axes.grapharea.effectiveViewRect.y + axes.grapharea.effectiveViewRect.height)

                 onValueModified: root._setLimits()
             }
             Item {
                 QQL.Layout.fillWidth: true
             }
         }
         QGLPreFabs.XYAxes {
             id: axes

             QQL.Layout.fillHeight: true
             QQL.Layout.fillWidth: true
             grapharea.viewTransform: pinchArea.viewTransform
             viewRect: Qt.rect(-20, -110, 760, 220)
             xLabel: "Angle (°)"
             yLabel: "Value"

             QuickGraphLib.ZoomPanHandler {
                 id: pinchArea

                 anchors.fill: parent
             }
             QGLGraphItems.Line {
                 id: sinLine

                 dataTransform: axes.dataTransform
                 path: QuickGraphLib.Helpers.linspace(0, 720, 100).map(x => Qt.point(x, Math.sin(x / 180 * Math.PI) * 100))
                 strokeColor: "red"
                 strokeWidth: 2
             }
             QGLGraphItems.BasicLegend {
                 anchors.margins: 10
                 anchors.right: parent.right
                 anchors.top: parent.top

                 QGLGraphItems.BasicLegendItem {
                     strokeColor: sinLine.strokeColor
                     text: "Sin(θ)"
                 }
             }
         }
     }
 }