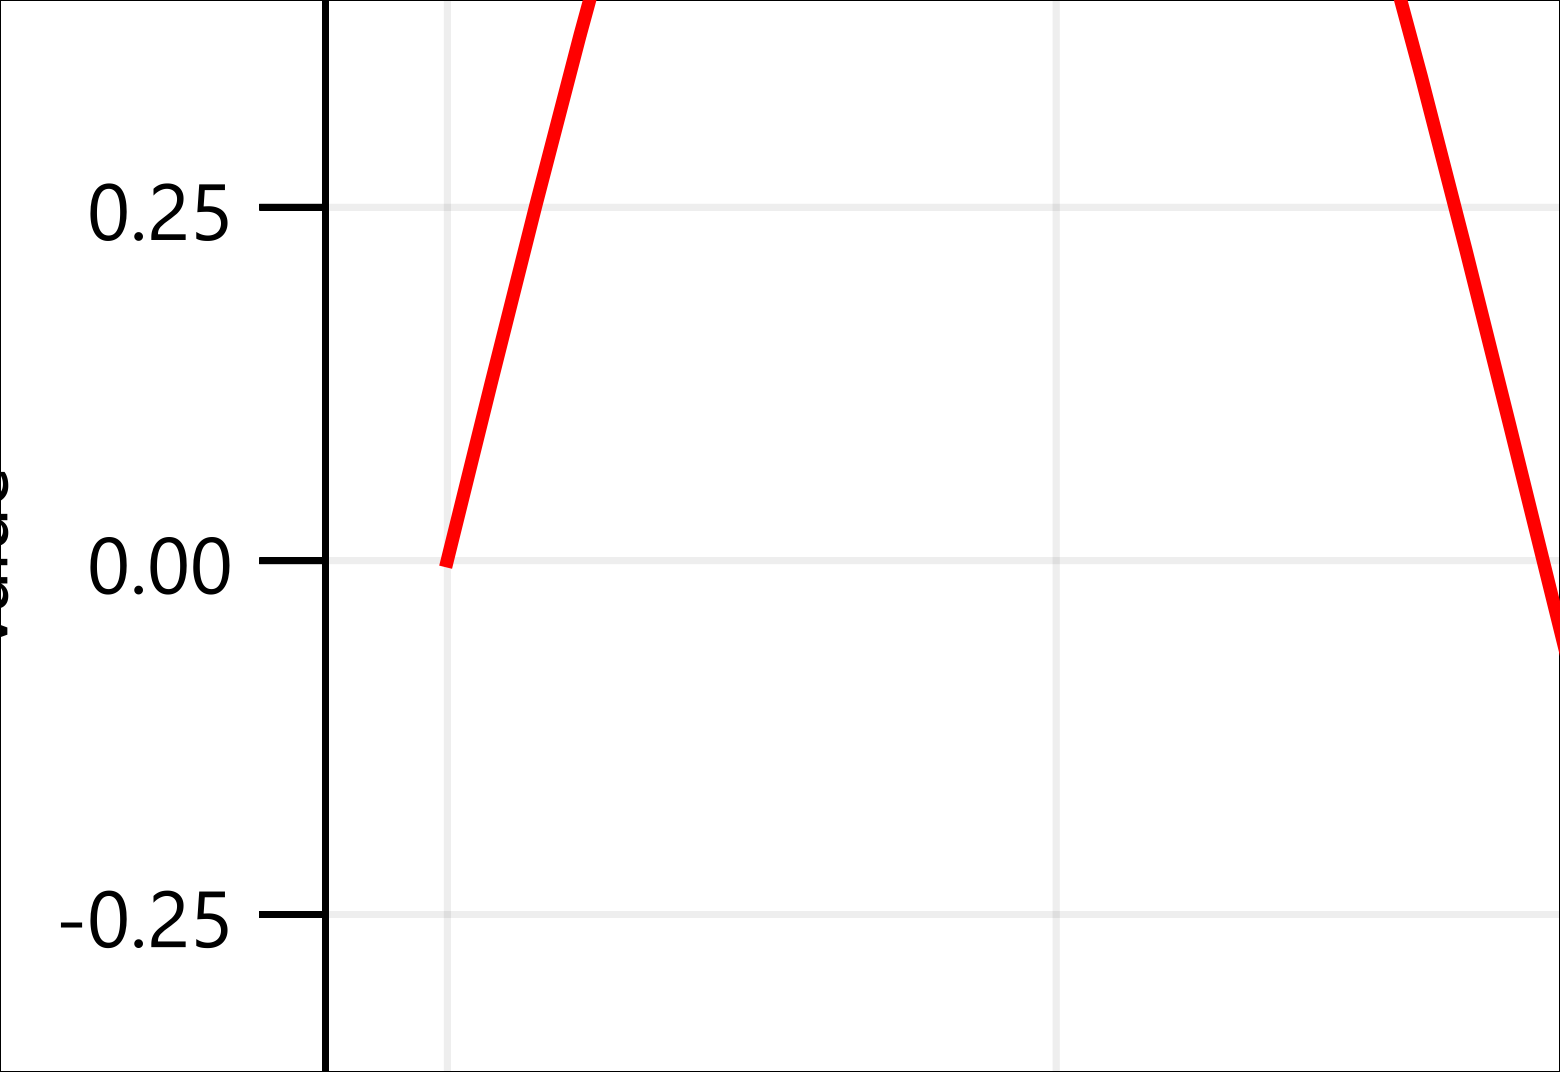
Zoomable as image
Zoom into a graph as if it were an image.

This example demonstrates using a ZoomPanHandler to handle conversion of user inputs to a transformation. The transformation is then applied to the XYAxes's GridLayout, which will cause the entire graph to scale/translate, just like an image. To change the axes limits instead, see the Zoomable axes example.
 // SPDX-FileCopyrightText: Copyright (c) 2024 Refeyn Ltd and other QuickGraphLib contributors
 // SPDX-License-Identifier: MIT

 import QtQuick
 import QuickGraphLib as QuickGraphLib
 import QuickGraphLib.GraphItems as QGLGraphItems
 import QuickGraphLib.PreFabs as QGLPreFabs

 Item {
     QuickGraphLib.ZoomPanHandler {
         id: pinchArea

         anchors.fill: parent
     }
     QGLPreFabs.XYAxes {
         id: axes

         anchors.fill: parent
         viewRect: Qt.rect(-20, -1.1, 760, 2.2)
         xLabel: "Angle (°)"
         yLabel: "Value"

         axes.transform: Matrix4x4 {
             matrix: pinchArea.viewTransform
         }

         QGLGraphItems.Line {
             id: sinLine

             dataTransform: axes.dataTransform
             path: QuickGraphLib.Helpers.linspace(0, 720, 100).map(x => Qt.point(x, Math.sin(x / 180 * Math.PI)))
             strokeColor: "red"
             strokeWidth: 2
         }
         QGLGraphItems.BasicLegend {
             anchors.margins: 10
             anchors.right: parent.right
             anchors.top: parent.top

             QGLGraphItems.BasicLegendItem {
                 strokeColor: sinLine.strokeColor
                 text: "Sin(θ)"
             }
         }
     }
 }