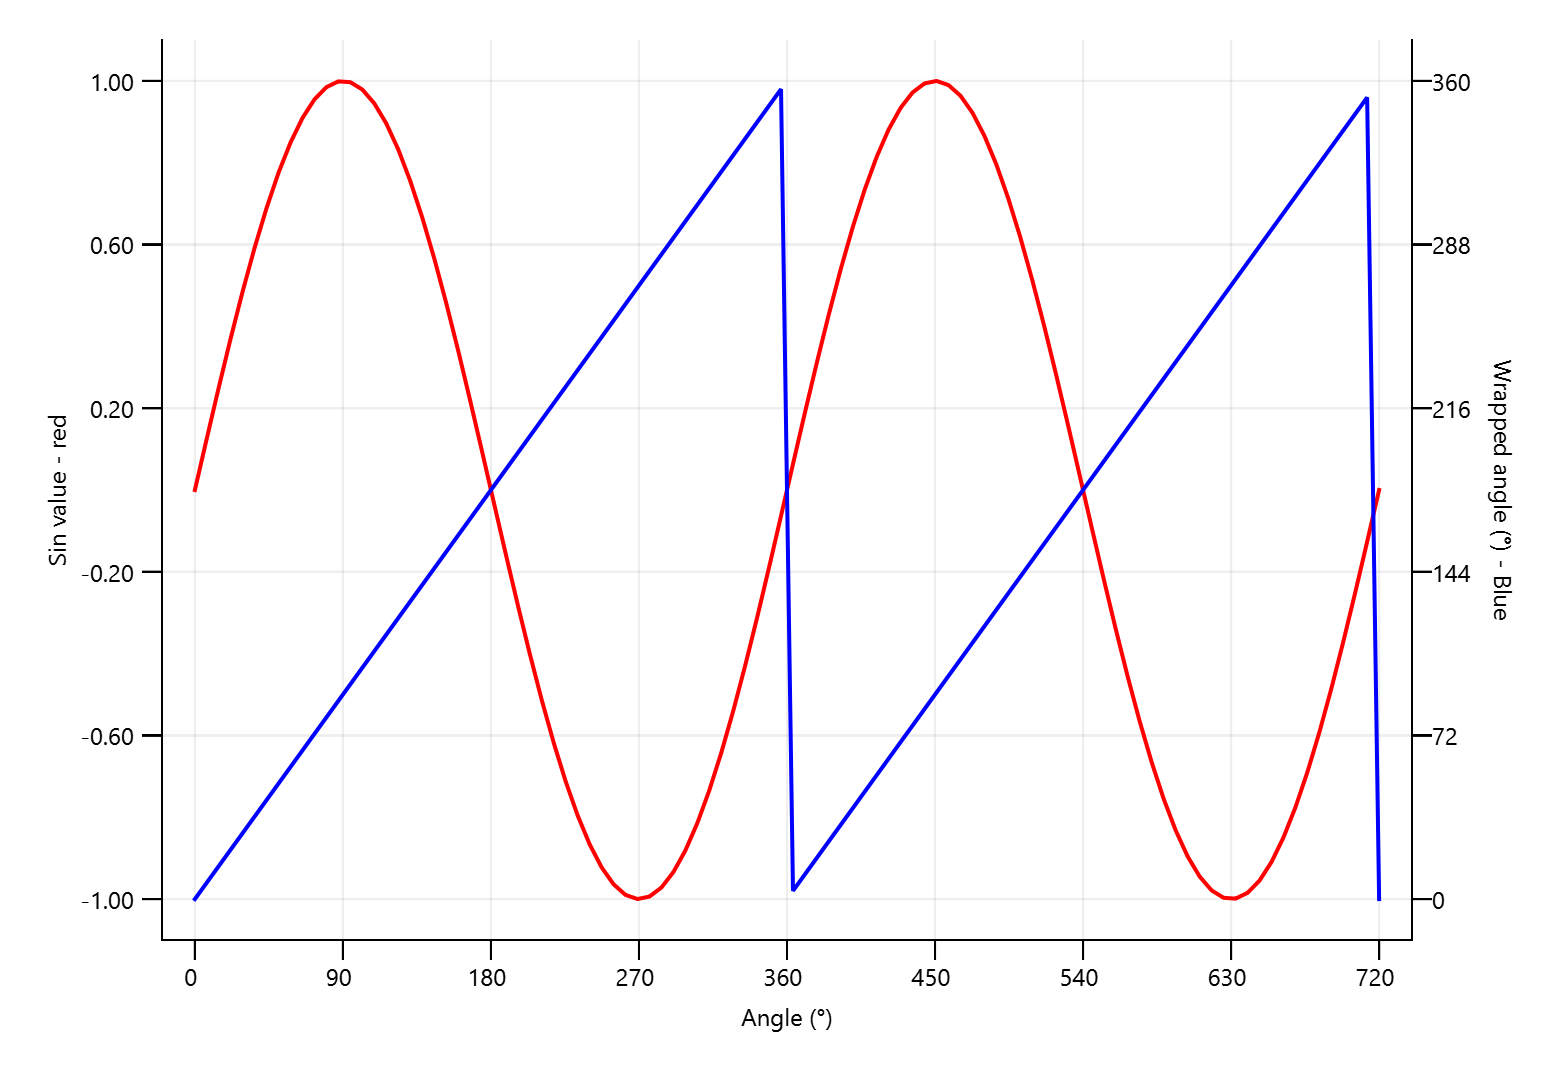
Twinned X axis
Two graphs with different GraphAreas sharing the same X axis.

This example demonstrates using multiple GraphAreas to display two Y axes with the same X axis. Each Y axis has it's own GraphArea, as the view rect for each is different. Since GraphAreas are transparent, this does not cause any occlusion problems.
 // SPDX-FileCopyrightText: Copyright (c) 2024 Refeyn Ltd and other QuickGraphLib contributors
 // SPDX-License-Identifier: MIT

 import QtQuick
 import QtQuick.Layouts as QQL
 import QuickGraphLib as QuickGraphLib
 import QuickGraphLib.GraphItems as QGLGraphItems

 Item {
     QQL.GridLayout {
         anchors.fill: parent
         anchors.margins: 20
         columnSpacing: 0
         columns: 3
         rowSpacing: 0

         QuickGraphLib.Axis {
             id: yAxis

             QQL.Layout.fillHeight: true
             dataTransform: grapharea.dataTransform
             direction: QuickGraphLib.Axis.Direction.Left
             label: "Sin value - red"
             ticks: QuickGraphLib.Helpers.linspace(-1.0, 1.0, 6)
         }
         Item {
             QQL.Layout.fillHeight: true
             QQL.Layout.fillWidth: true

             QuickGraphLib.GraphArea {
                 id: grapharea

                 anchors.fill: parent
                 viewRect: Qt.rect(-20, -1.1, 760, 2.2)

                 QGLGraphItems.Grid {
                     dataTransform: grapharea.dataTransform
                     strokeColor: "#11000000"
                     strokeWidth: 1
                     viewRect: grapharea.viewRect
                     xTicks: xAxis.ticks
                     yTicks: yAxis.ticks
                 }
                 QGLGraphItems.Line {
                     dataTransform: grapharea.dataTransform
                     path: QuickGraphLib.Helpers.linspace(0, 720, 100).map(x => Qt.point(x, Math.sin(x / 180 * Math.PI)))
                     strokeColor: "red"
                     strokeWidth: 2
                 }
             }
             QuickGraphLib.GraphArea {
                 id: graphareaTwinned

                 anchors.fill: parent
                 viewRect: Qt.rect(-20, -18, 760, 396)

                 QGLGraphItems.Line {
                     dataTransform: graphareaTwinned.dataTransform
                     path: QuickGraphLib.Helpers.linspace(0, 720, 100).map(x => Qt.point(x, x % 360))
                     strokeColor: "blue"
                     strokeWidth: 2
                 }
             }
         }
         QuickGraphLib.Axis {
             id: yAxisTwinned

             QQL.Layout.fillHeight: true
             dataTransform: graphareaTwinned.dataTransform
             decimalPoints: 0
             direction: QuickGraphLib.Axis.Direction.Right
             label: "Wrapped angle (°) - Blue"
             ticks: QuickGraphLib.Helpers.linspace(0, 360, 6)
         }
         Item {
         }
         QuickGraphLib.Axis {
             id: xAxis

             QQL.Layout.fillWidth: true
             dataTransform: grapharea.dataTransform
             decimalPoints: 0
             direction: QuickGraphLib.Axis.Direction.Bottom
             label: "Angle (°)"
             ticks: QuickGraphLib.Helpers.linspace(0, 720, 9)
         }
         Item {
         }
     }
 }