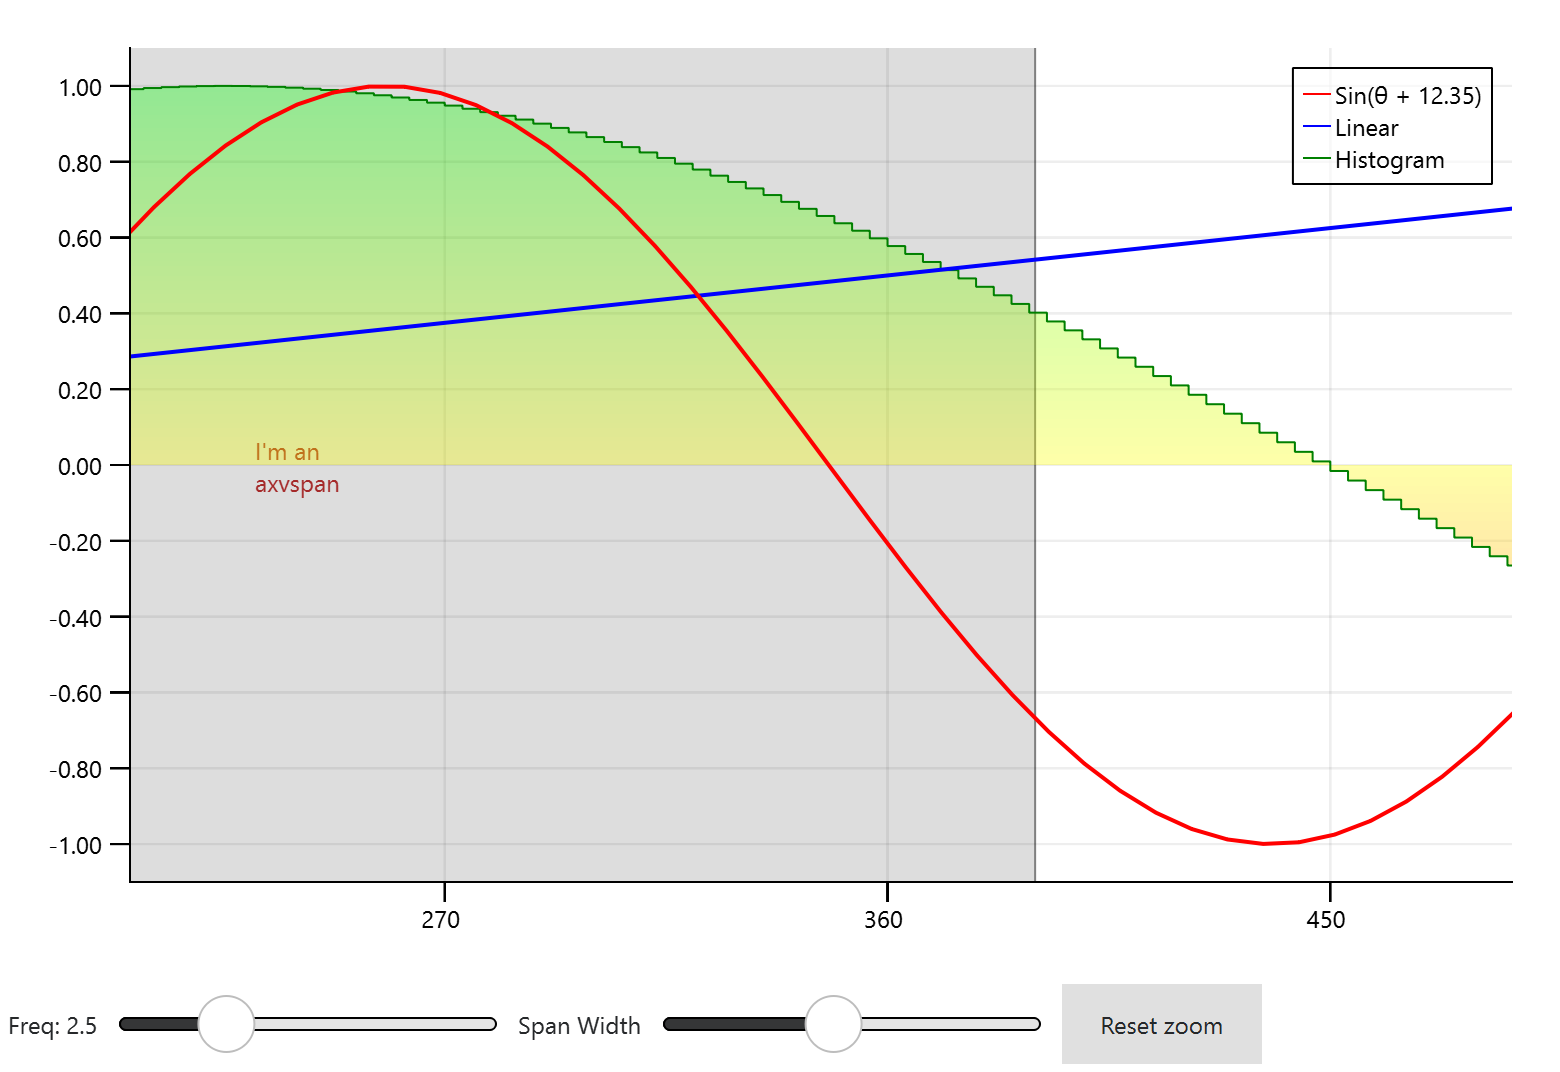
Complex graph
A complex graph with lines, histograms, changing data and user interaction.

This example is a spaghetti mess of various plots on the same axes. It can be used as an example of how to structure graphs, or as an example of what to avoid. Your choice.
 // SPDX-FileCopyrightText: Copyright (c) 2024 Refeyn Ltd and other QuickGraphLib contributors
 // SPDX-License-Identifier: MIT

 pragma ComponentBehavior: Bound
 import QtQuick
 import QtQuick.Shapes as QQS
 import QtQuick.Layouts as QQL
 import QtQuick.Controls as QQC
 import QuickGraphLib as QuickGraphLib
 import QuickGraphLib.GraphItems as QGLGraphItems

 Item {
     id: root

     property double offset: 0

     Timer {
         interval: 1000 / 60
         repeat: true
         running: true

         onTriggered: root.offset += 1 / 60
     }
     QQL.ColumnLayout {
         anchors.fill: parent
         anchors.margins: 4

         Item {
             QQL.Layout.fillHeight: true
             QQL.Layout.fillWidth: true

             QQL.GridLayout {
                 anchors.fill: parent
                 anchors.margins: 20
                 columnSpacing: 0
                 columns: 2
                 rowSpacing: 0

                 QuickGraphLib.Axis {
                     id: yAxis

                     QQL.Layout.fillHeight: true
                     dataTransform: grapharea.dataTransform
                     direction: QuickGraphLib.Axis.Direction.Left
                     ticks: QuickGraphLib.Helpers.linspace(-1.0, 1.0, 11)
                 }
                 QuickGraphLib.GraphArea {
                     id: grapharea

                     QQL.Layout.fillHeight: true
                     QQL.Layout.fillWidth: true
                     viewRect: Qt.rect(-20, -1.1, 760, 2.2)
                     viewTransform: pinchArea.viewTransform

                     QuickGraphLib.ZoomPanHandler {
                         id: pinchArea

                         anchors.fill: parent
                         maxScale: Qt.size(20, 1)
                     }
                     QGLGraphItems.Grid {
                         dataTransform: grapharea.dataTransform
                         strokeColor: "#11000000"
                         strokeWidth: 1
                         viewRect: grapharea.viewRect
                         xTicks: xAxis.ticks
                         yTicks: yAxis.ticks
                     }
                     QuickGraphLib.ShapeRepeater {
                         graphArea: grapharea
                         model: QuickGraphLib.Helpers.linspace(0, 720, freqSlider.value)

                         QGLGraphItems.AxVLine {
                             required property var modelData

                             dataTransform: grapharea.dataTransform
                             position: modelData
                             strokeColor: "blue"
                             strokeWidth: 3
                             viewRect: grapharea.viewRect
                         }
                     }
                     QGLGraphItems.AxVSpan {
                         id: span

                         dataTransform: grapharea.dataTransform
                         fillColor: "#22000000"
                         strokeColor: "grey"
                         strokeWidth: 1
                         viewRect: grapharea.viewRect
                         xMax: 90 + spanSlider.value
                         xMin: 90
                     }
                     Text {
                         color: "brown"
                         horizontalAlignment: Text.AlignHCenter
                         text: "I'm an\naxvspan"
                         x: (span.topLeftPoint.x + span.bottomRightPoint.x) / 2 - width / 2
                         y: (span.topLeftPoint.y + span.bottomRightPoint.y) / 2 - height / 2
                     }
                     QGLGraphItems.Histogram {
                         id: histogram

                         bins: QuickGraphLib.Helpers.linspace(0, 720, 201)
                         dataTransform: grapharea.dataTransform
                         heights: QuickGraphLib.Helpers.linspace(0, 720, 200).map(x => Math.sin(x / 180 * Math.PI / freqSlider.value))
                         strokeColor: "green"
                         strokeWidth: 1

                         fillGradient: QQS.LinearGradient {
                             y1: grapharea.dataTransform.map(Qt.point(0, 1)).y
                             y2: grapharea.dataTransform.map(Qt.point(0, -1)).y

                             GradientStop {
                                 color: "#5500ff00"
                                 position: 0.0
                             }
                             GradientStop {
                                 color: "#55ffff00"
                                 position: 0.5
                             }
                             GradientStop {
                                 color: "#55ff0000"
                                 position: 1.0
                             }
                         }
                     }
                     QGLGraphItems.Line {
                         id: linearLine

                         dataTransform: grapharea.dataTransform
                         path: QuickGraphLib.Helpers.linspace(0, 720, 100).map(x => Qt.point(x, x / 720))
                         strokeColor: "blue"
                         strokeWidth: 2
                     }
                     QGLGraphItems.Line {
                         id: sinLine

                         dataTransform: grapharea.dataTransform
                         path: QuickGraphLib.Helpers.linspace(0, 720, 100).map(x => Qt.point(x, Math.sin(x / 180 * Math.PI + root.offset)))
                         strokeColor: "red"
                         strokeWidth: 2
                     }
                     Text {
                         property point pos: grapharea.dataTransform.map(Qt.point(360 - (root.offset / Math.PI * 180) % 360 + 90, 1))

                         horizontalAlignment: Text.AlignHCenter
                         text: "A peak!"
                         x: pos.x - width / 2
                         y: pos.y - height

                         Rectangle {
                             anchors.fill: parent
                             color: "yellow"
                             opacity: 0.5
                             z: -1
                         }
                     }
                     QGLGraphItems.BasicLegend {
                         anchors.margins: 10
                         anchors.right: parent?.right
                         anchors.top: parent?.top

                         QGLGraphItems.BasicLegendItem {
                             strokeColor: sinLine.strokeColor
                             text: "Sin(θ + %1)".arg(Number(root.offset).toFixed(2))
                         }
                         QGLGraphItems.BasicLegendItem {
                             strokeColor: linearLine.strokeColor
                             text: "Linear"
                         }
                         QGLGraphItems.BasicLegendItem {
                             fillGradient: histogram.fillGradient
                             strokeColor: histogram.strokeColor
                             text: "Histogram"
                         }
                     }
                 }
                 Item {
                 }
                 QuickGraphLib.Axis {
                     id: xAxis

                     QQL.Layout.fillWidth: true
                     dataTransform: grapharea.dataTransform
                     decimalPoints: 0
                     direction: QuickGraphLib.Axis.Direction.Bottom
                     ticks: QuickGraphLib.Helpers.linspace(0, 720, 9)
                 }
             }
         }
         QQL.RowLayout {
             QQC.Label {
                 text: "Freq: %1".arg(Number(freqSlider.value).toFixed(1))
             }
             QQC.Slider {
                 id: freqSlider

                 from: 0.1
                 stepSize: 0.1
                 to: 10
             }
             QQC.Label {
                 text: "Span Width"
             }
             QQC.Slider {
                 id: spanSlider

                 from: 90
                 stepSize: 30
                 to: 540
             }
             QQC.Button {
                 text: "Reset zoom"

                 onClicked: pinchArea.reset()
             }
         }
     }
 }