Peak buttons
A histogram with a button and mouse area above each peak.
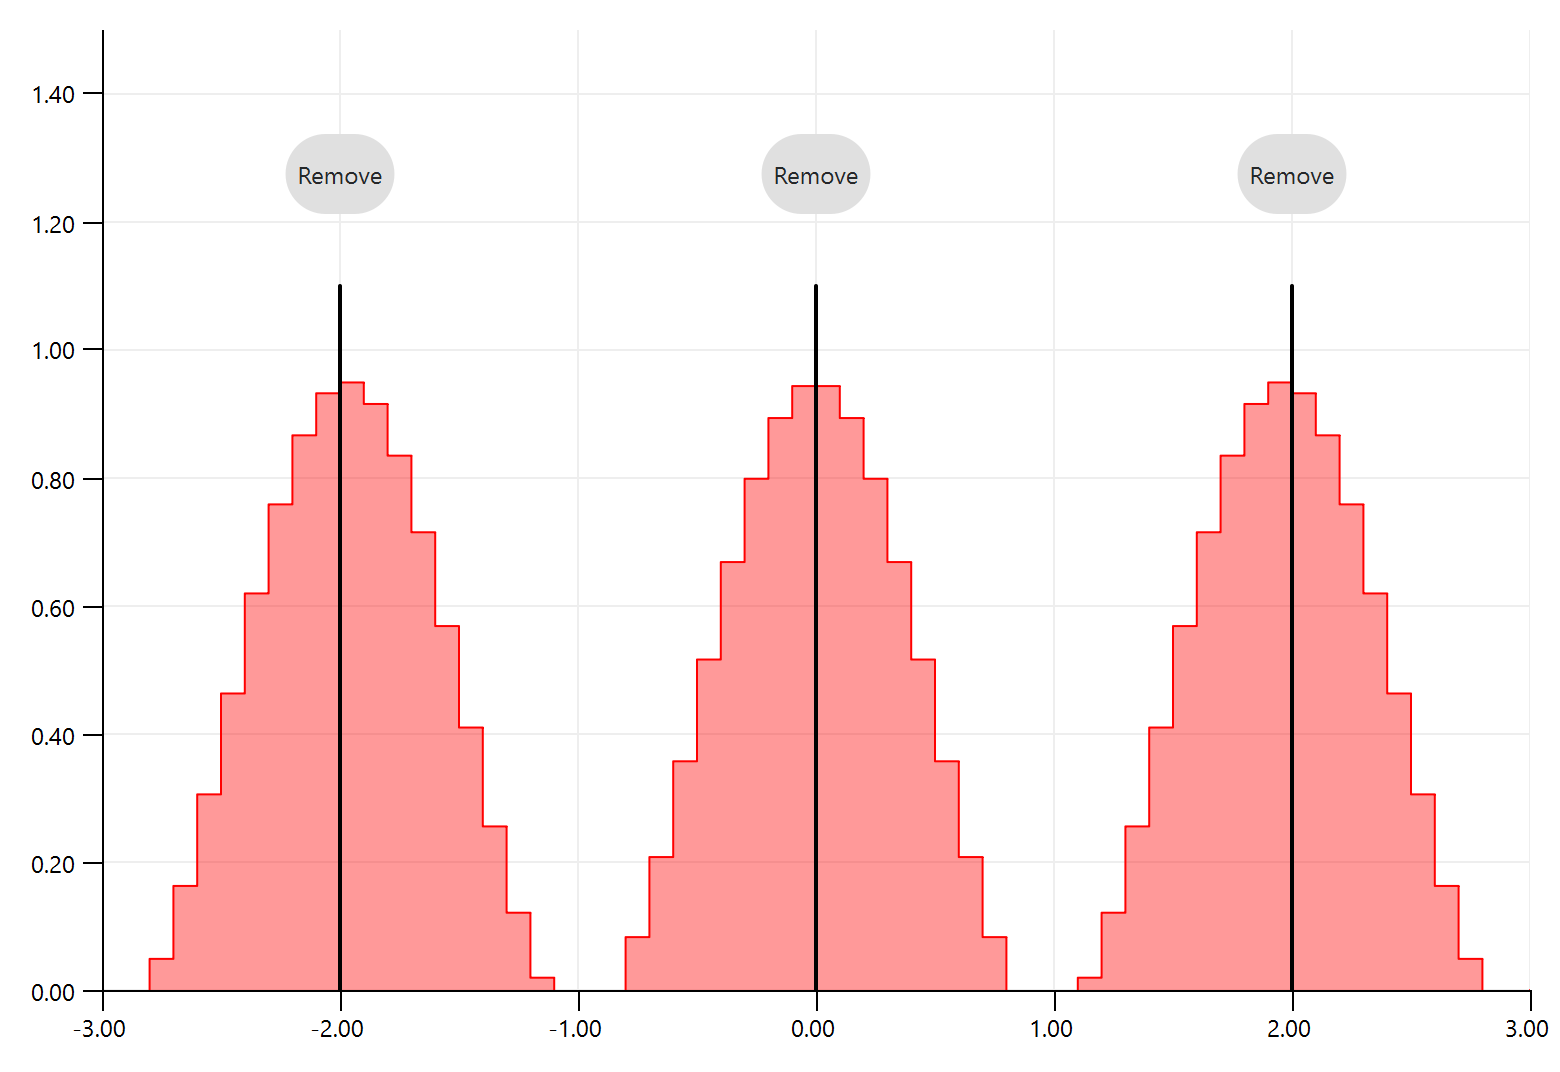
This example demonstrates controls and other interactive elements positioned based on the data.
 // SPDX-FileCopyrightText: Copyright (c) 2024 Refeyn Ltd and other QuickGraphLib contributors
 // SPDX-License-Identifier: MIT

 import QtQuick
 import QtQuick.Controls as QQC
 import QuickGraphLib as QuickGraphLib
 import QuickGraphLib.GraphItems as QGLGraphItems
 import QuickGraphLib.PreFabs as QGLPreFabs

 Item {
     QGLPreFabs.XYAxes {
         id: root

         property var markedPeaks: [-2, 0, 2]

         anchors.fill: parent
         viewRect: Qt.rect(-3, 0, 6, 1.5)

         QGLGraphItems.Histogram {
             bins: QuickGraphLib.Helpers.linspace(-3, 3, 61)
             dataTransform: root.dataTransform
             fillColor: "#66ff0000"
             heights: QuickGraphLib.Helpers.linspace(-3, 3, 60).map(i => (Math.cos(i * Math.PI) + 0.9) / 2)
             strokeColor: "red"
             strokeWidth: 1
         }
         QuickGraphLib.ShapeRepeater {
             graphArea: root.grapharea
             model: root.markedPeaks

             QGLGraphItems.Line {
                 required property double modelData

                 dataTransform: root.dataTransform
                 path: [Qt.point(modelData, 0), Qt.point(modelData, 1.1)]
                 strokeColor: "black"
                 strokeWidth: 2
             }
         }
         Repeater {
             model: root.markedPeaks

             MouseArea {
                 property point bottomLeft: root.dataTransform.map(Qt.point(modelData - 1, 0))
                 required property double modelData
                 property point topRight: root.dataTransform.map(Qt.point(modelData + 1, 1.5))

                 height: bottomLeft.y - topRight.y
                 width: topRight.x - bottomLeft.x
                 x: bottomLeft.x
                 y: topRight.y

                 onClicked: root.markedPeaks = root.markedPeaks.filter(p => p != modelData)
             }
         }
         Repeater {
             model: root.markedPeaks

             QQC.RoundButton {
                 required property double modelData
                 property point xyPos: root.dataTransform.map(Qt.point(modelData, 1.2))

                 text: "Remove"
                 x: xyPos.x - width / 2
                 y: xyPos.y - height - 4

                 onClicked: root.markedPeaks = root.markedPeaks.filter(p => p != modelData)
             }
         }
     }
 }