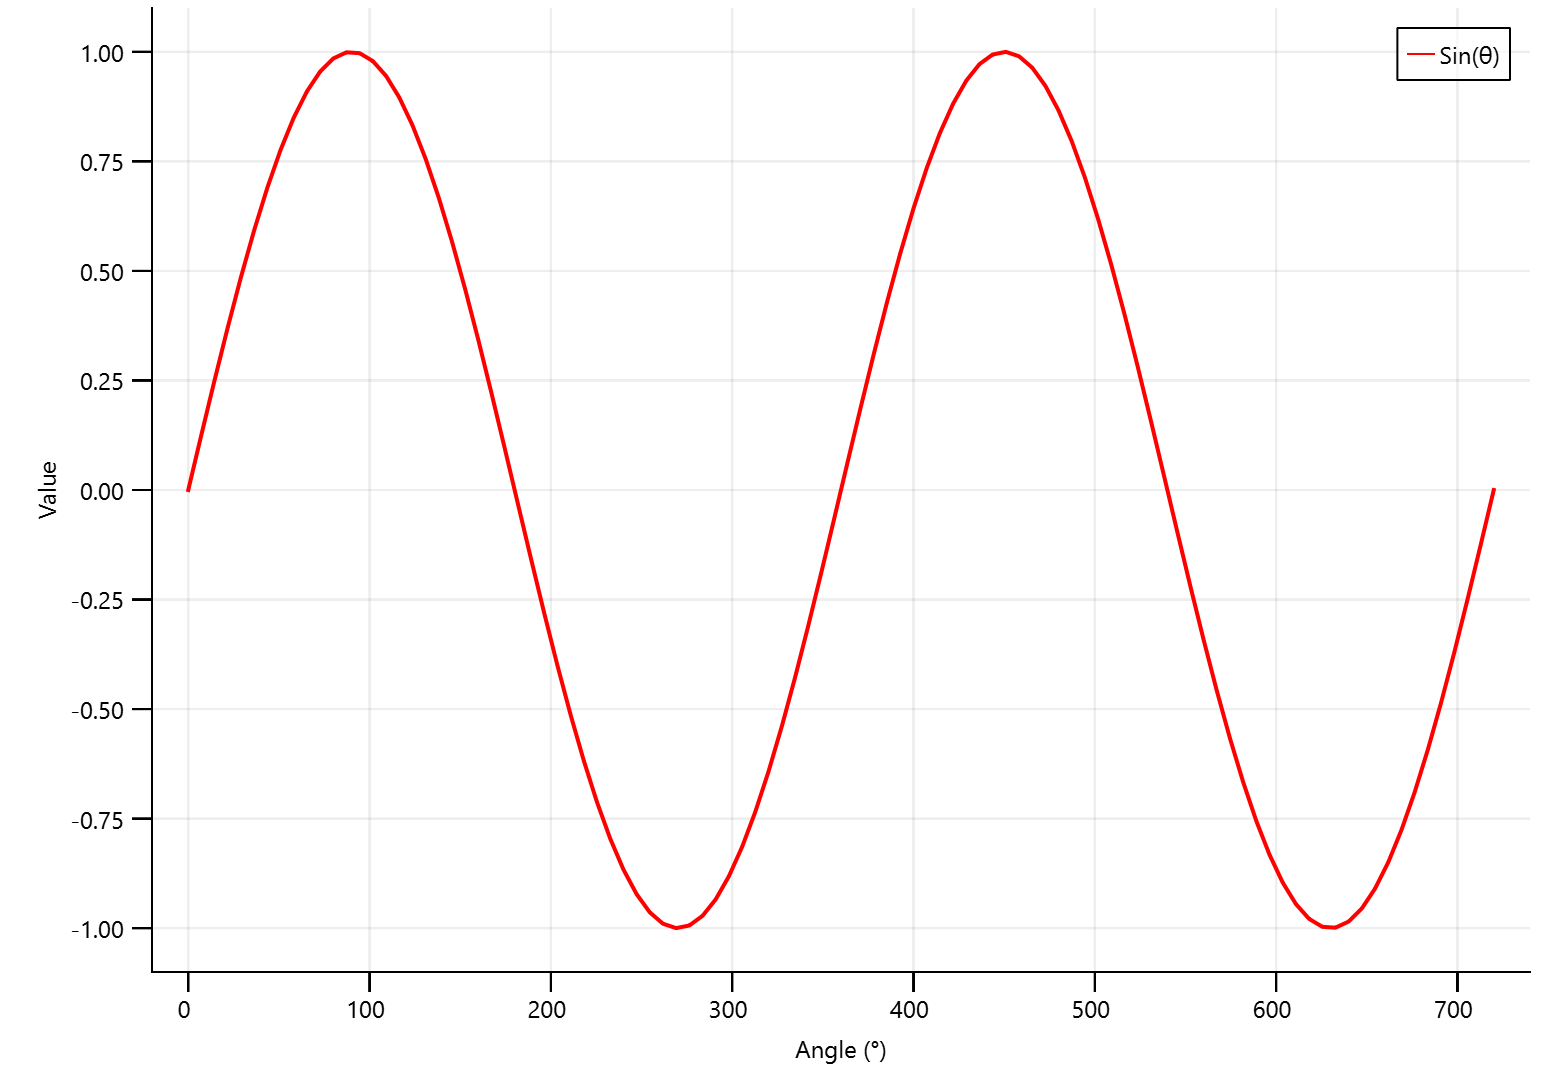
Basic sin graph (without prefabs)
A simple graph of a sin function (without prefabs).

This example is the same as Basic sin graph, except that it does not use XYAxes (and it takes advantage of that by changing the number of decimal points in the X axis). This is a good base for starting your own customisations, such as multiple axes or subplots.
 // SPDX-FileCopyrightText: Copyright (c) 2024 Refeyn Ltd and other QuickGraphLib contributors
 // SPDX-License-Identifier: MIT

 import QtQuick
 import QtQuick.Layouts as QQL
 import QuickGraphLib as QuickGraphLib
 import QuickGraphLib.GraphItems as QGLGraphItems

 Item {
     QQL.GridLayout {
         anchors.bottomMargin: 4
         anchors.fill: parent
         anchors.leftMargin: 15
         anchors.rightMargin: 15
         anchors.topMargin: 4
         columnSpacing: 0
         columns: 2
         rowSpacing: 0

         QuickGraphLib.Axis {
             id: yAxis

             QQL.Layout.fillHeight: true
             dataTransform: grapharea.dataTransform
             direction: QuickGraphLib.Axis.Direction.Left
             label: "Value"
             ticks: QuickGraphLib.Helpers.tickLocator(-1.1, 1.1, 11)
         }
         QuickGraphLib.GraphArea {
             id: grapharea

             QQL.Layout.fillHeight: true
             QQL.Layout.fillWidth: true
             viewRect: Qt.rect(-20, -1.1, 760, 2.2)

             QGLGraphItems.Grid {
                 dataTransform: grapharea.dataTransform
                 strokeColor: "#11000000"
                 strokeWidth: 1
                 viewRect: grapharea.viewRect
                 xTicks: xAxis.ticks
                 yTicks: yAxis.ticks
             }
             QGLGraphItems.Line {
                 id: sinLine

                 dataTransform: grapharea.dataTransform
                 path: QuickGraphLib.Helpers.linspace(0, 720, 100).map(x => Qt.point(x, Math.sin(x / 180 * Math.PI)))
                 strokeColor: "red"
                 strokeWidth: 2
             }
             QGLGraphItems.BasicLegend {
                 anchors.margins: 10
                 anchors.right: parent.right
                 anchors.top: parent.top

                 QGLGraphItems.BasicLegendItem {
                     strokeColor: sinLine.strokeColor
                     text: "Sin(θ)"
                 }
             }
         }
         Item {
         }
         QuickGraphLib.Axis {
             id: xAxis

             QQL.Layout.fillWidth: true
             dataTransform: grapharea.dataTransform
             decimalPoints: 0
             direction: QuickGraphLib.Axis.Direction.Bottom
             label: "Angle (°)"
             ticks: QuickGraphLib.Helpers.tickLocator(-20, 740, 11)
         }
     }
 }