Subgraphs
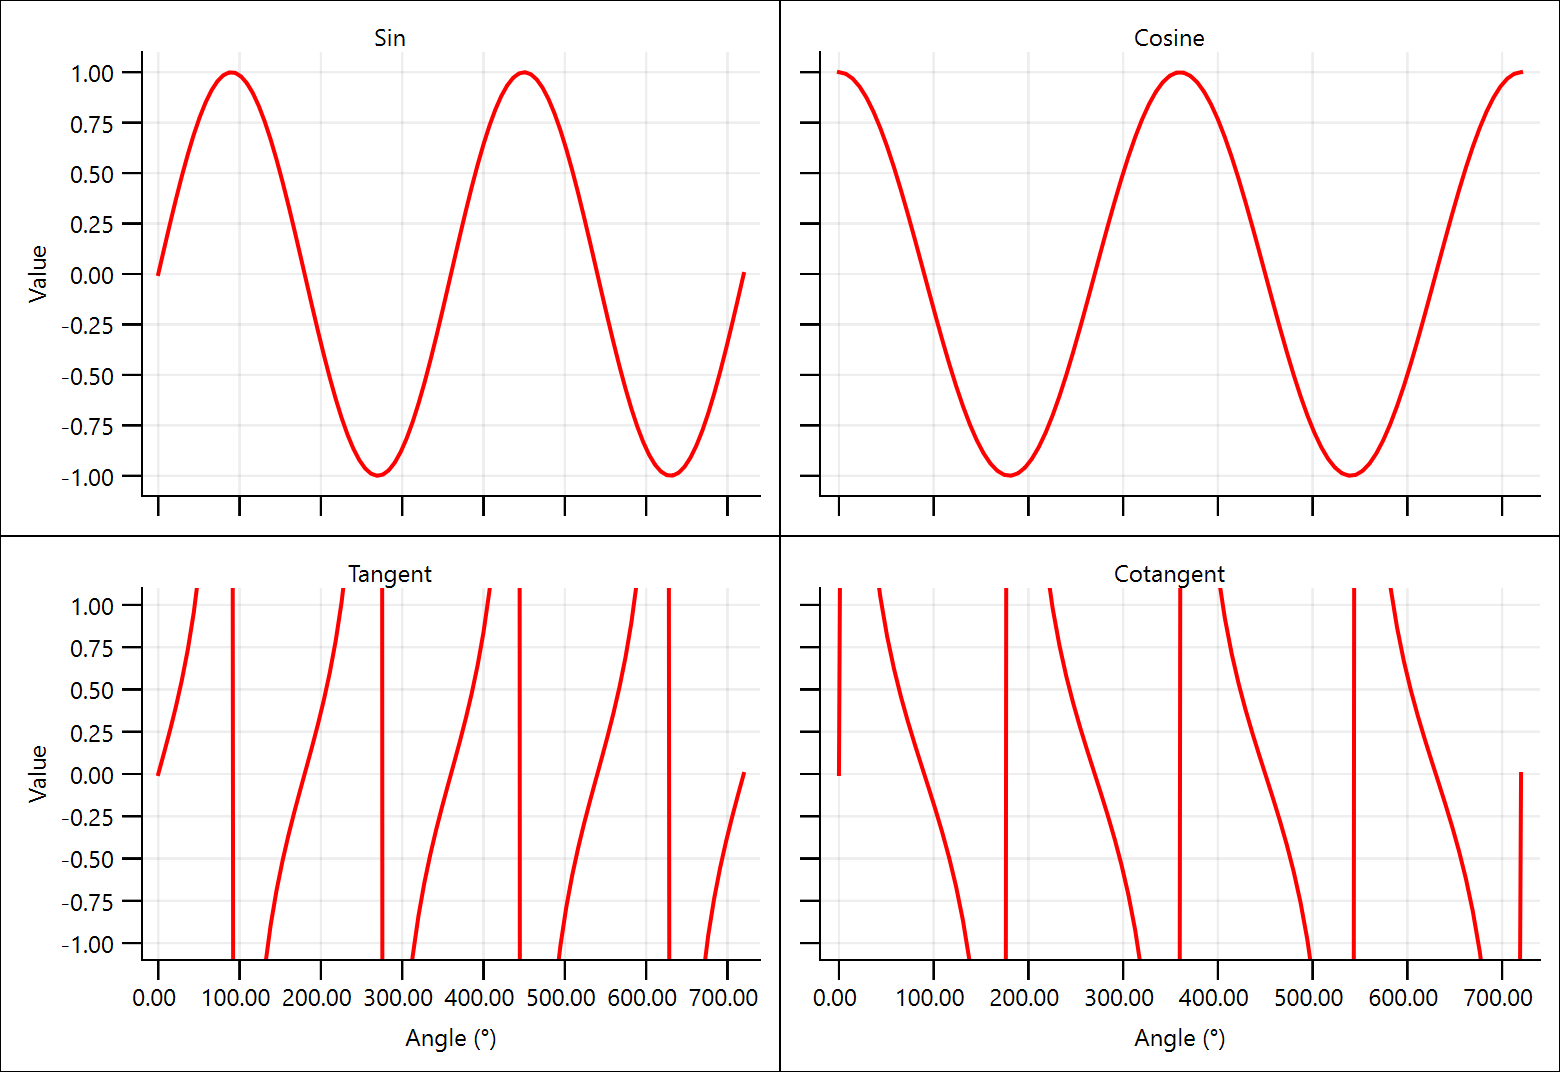
Four subgraphs with hidden axes.

This example demonstrates using multiple XYAxes to form a 2x2 grid of subplots. This is the easier way to achieve this, but if more control over spacing is needed, then prefabs should not be used.
 // SPDX-FileCopyrightText: Copyright (c) 2024 Refeyn Ltd and other QuickGraphLib contributors
 // SPDX-License-Identifier: MIT

 import QtQuick
 import QtQuick.Layouts as QQL
 import QuickGraphLib as QuickGraphLib
 import QuickGraphLib.GraphItems as QGLGraphItems
 import QuickGraphLib.PreFabs as QGLPreFabs

 QQL.GridLayout {
     columnSpacing: 0
     columns: 2
     rowSpacing: 0

     QGLPreFabs.XYAxes {
         id: sinAxes

         QQL.Layout.fillHeight: true
         QQL.Layout.fillWidth: true
         title: "Sin"
         viewRect: Qt.rect(-20, -1.1, 760, 2.2)
         xAxis.showTickLabels: false
         yLabel: "Value"

         QGLGraphItems.Line {
             dataTransform: sinAxes.dataTransform
             path: QuickGraphLib.Helpers.linspace(0, 720, 100).map(x => Qt.point(x, Math.sin(x / 180 * Math.PI)))
             strokeColor: "red"
             strokeWidth: 2
         }
     }
     QGLPreFabs.XYAxes {
         id: cosAxes

         QQL.Layout.fillHeight: true
         QQL.Layout.fillWidth: true
         title: "Cosine"
         viewRect: Qt.rect(-20, -1.1, 760, 2.2)
         xAxis.showTickLabels: false
         yAxis.showTickLabels: false

         QGLGraphItems.Line {
             dataTransform: cosAxes.dataTransform
             path: QuickGraphLib.Helpers.linspace(0, 720, 100).map(x => Qt.point(x, Math.cos(x / 180 * Math.PI)))
             strokeColor: "red"
             strokeWidth: 2
         }
     }
     QGLPreFabs.XYAxes {
         id: tanAxes

         QQL.Layout.fillHeight: true
         QQL.Layout.fillWidth: true
         title: "Tangent"
         viewRect: Qt.rect(-20, -1.1, 760, 2.2)
         xLabel: "Angle (°)"
         yLabel: "Value"

         QGLGraphItems.Line {
             dataTransform: tanAxes.dataTransform
             path: QuickGraphLib.Helpers.linspace(0, 720, 100).map(x => Qt.point(x, Math.tan(x / 180 * Math.PI)))
             strokeColor: "red"
             strokeWidth: 2
         }
     }
     QGLPreFabs.XYAxes {
         id: cotAxes

         QQL.Layout.fillHeight: true
         QQL.Layout.fillWidth: true
         title: "Cotangent"
         viewRect: Qt.rect(-20, -1.1, 760, 2.2)
         xLabel: "Angle (°)"
         yAxis.showTickLabels: false

         QGLGraphItems.Line {
             dataTransform: cotAxes.dataTransform
             path: QuickGraphLib.Helpers.linspace(0, 720, 100).map(x => Qt.point(x, x % 360 != 0 ? 1 / Math.tan(x / 180 * Math.PI) : 0))
             strokeColor: "red"
             strokeWidth: 2
         }
     }
 }