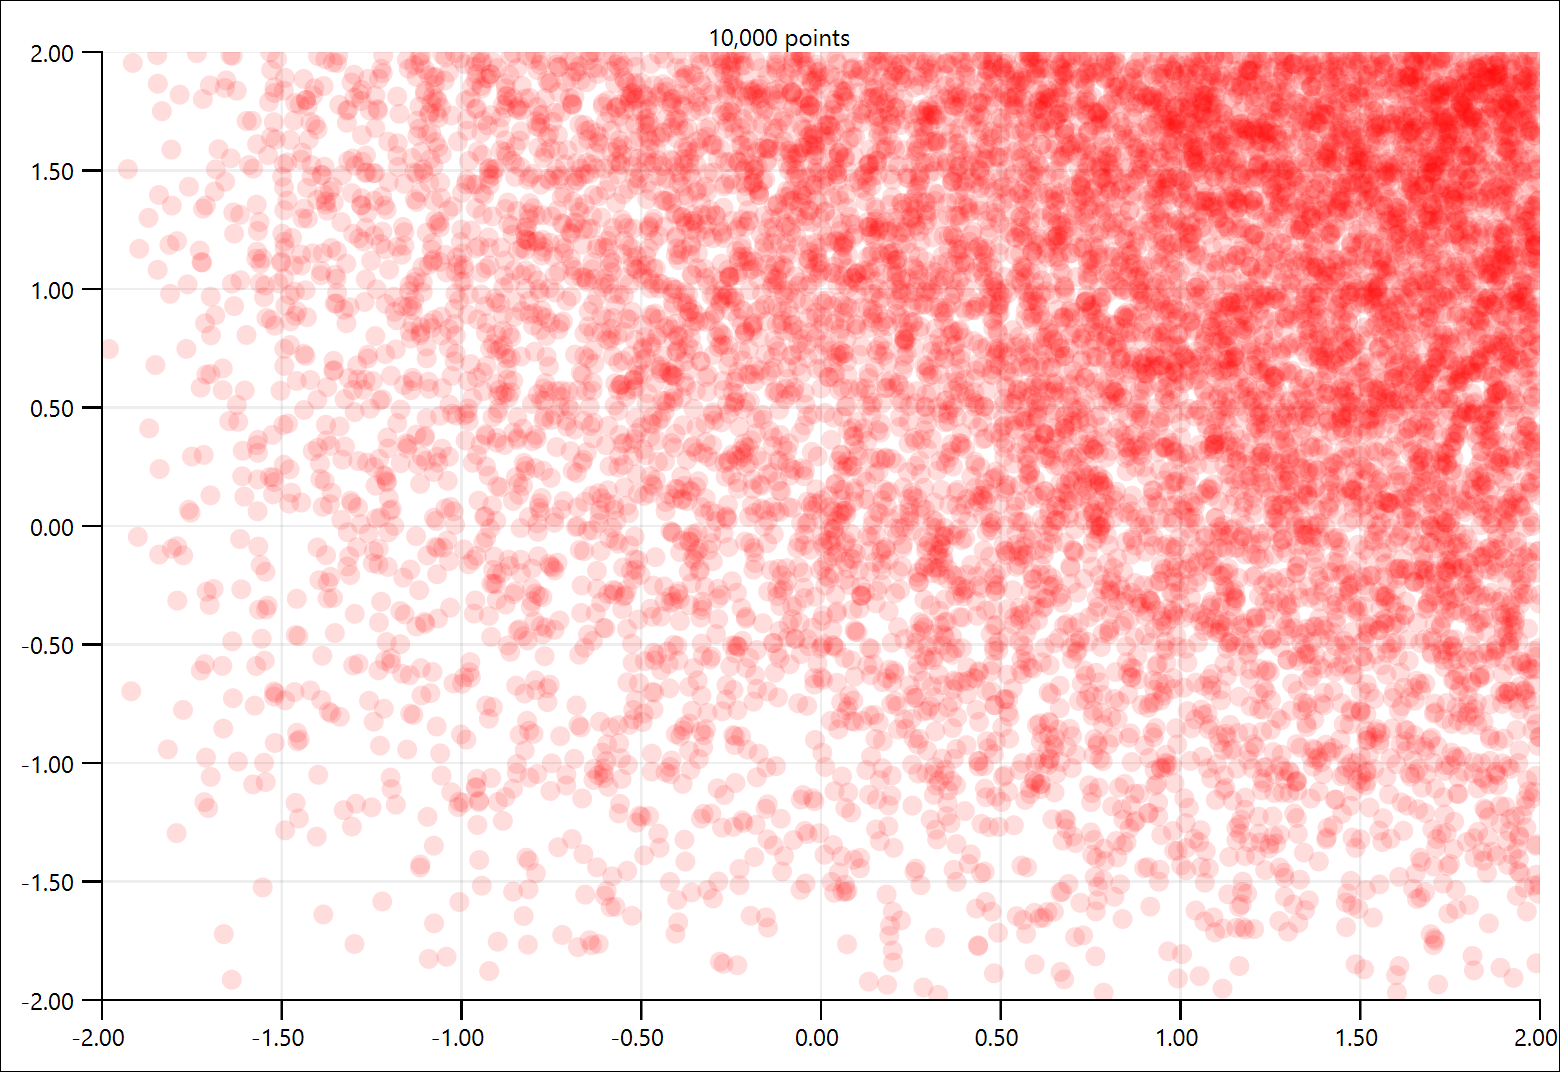
Scatter graph
A simple scatter graph with transparent markers.

This example demonstrates using a Repeater to display points in a scatter graph. Since repeaters can take models, you can easily incorporate extra data and give each point a different color or style.
 // SPDX-FileCopyrightText: Copyright (c) 2024 Refeyn Ltd and other QuickGraphLib contributors
 // SPDX-License-Identifier: MIT

 pragma ComponentBehavior: Bound
 import QtQuick
 import QuickGraphLib as QuickGraphLib
 import QuickGraphLib.GraphItems as QGLGraphItems
 import QuickGraphLib.PreFabs as QGLPreFabs

 QGLPreFabs.XYAxes {
     id: xyaxes

     property var butterflyCurve: QuickGraphLib.Helpers.linspace(0, Math.PI * 24, 10000).map(butterflyPoint)

     function butterflyPoint(t: real): point {
         let middle = Math.exp(Math.cos(t)) - 2 * Math.cos(4 * t) - Math.pow(Math.sin(t / 12), 5) + Math.sin(t * 1000);
         return Qt.point(Math.sin(t) * middle, Math.cos(t) * middle);
     }

     title: "10,000 points"
     viewRect: Qt.rect(-4.5, -4, 9, 9)

     Repeater {
         model: xyaxes.butterflyCurve

         QGLGraphItems.Marker {
             required property point modelData

             color: "#22ff0000"
             dataTransform: xyaxes.dataTransform
             position: modelData
             width: 10
         }
     }
 }