Rectangle
Rectangles and rectangular regions of interest in data coordinates.
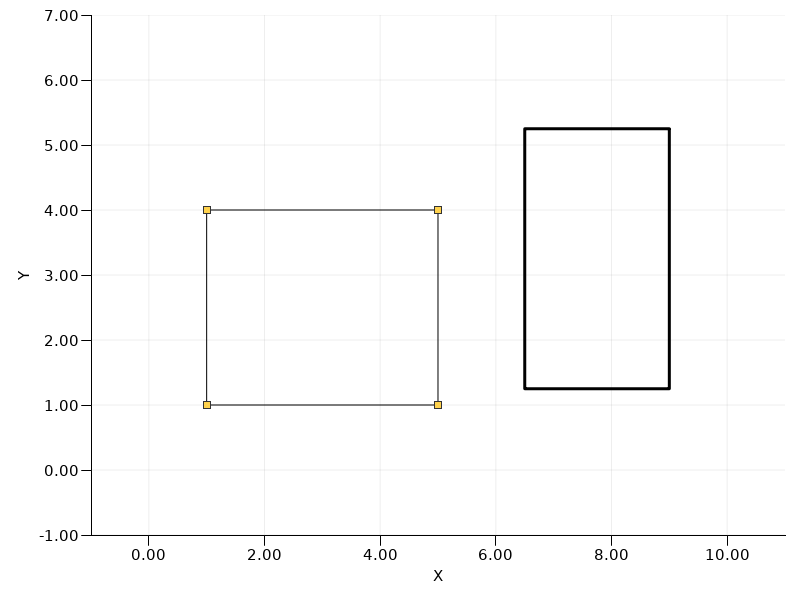
This example demonstrates using Rectangle to draw finite rectangles in data coordinates. The editable rectangle is paired with the RectangleHandles item so it can be selected, moved by dragging its body and resized by dragging its corner handles. Clicking empty plot space clears the selection and hides the handles.
 // SPDX-FileCopyrightText: Copyright (c) 2024 Refeyn Ltd and other QuickGraphLib contributors
 // SPDX-License-Identifier: MIT

 import QtQuick
 import QuickGraphLib.GraphItems as QGLGraphItems
 import QuickGraphLib.PreFabs as QGLPreFabs

 QGLPreFabs.XYAxes {
     id: axes

     property rect editableRect: Qt.rect(1, 1, 4, 3)
     property bool rectangleSelected: true

     function moveEditableRectangle(delta) {
         editableRect = Qt.rect(editableRect.x + delta.x, editableRect.y + delta.y, editableRect.width, editableRect.height);
     }

     viewRect: Qt.rect(-1, -1, 12, 8)
     xLabel: "X"
     yLabel: "Y"

     MouseArea {
         anchors.fill: parent

         onClicked: axes.rectangleSelected = false
     }
     QGLGraphItems.Rectangle {
         dataRect: Qt.rect(6.5, 1.25, 2.5, 4)
         dataTransform: axes.dataTransform
         fillColor: "transparent"
         strokeColor: "black"
         strokeWidth: 3
     }
     QGLGraphItems.Rectangle {
         id: editableRectangle

         dataRect: axes.editableRect
         dataTransform: axes.dataTransform
         fillColor: "transparent"
         strokeColor: "black"
         strokeWidth: 1
     }
     QGLGraphItems.RectangleHandles {
         dataRect: axes.editableRect
         dataTransform: axes.dataTransform
         handleMode: QGLGraphItems.RectangleHandles.Corners
         movable: true
         selected: axes.rectangleSelected

         onBodyClicked: axes.rectangleSelected = true
         onHandleClicked: axes.rectangleSelected = true
         onMoved: delta => axes.moveEditableRectangle(delta)
         onResized: dataRect => axes.editableRect = dataRect
     }
 }