Readout line
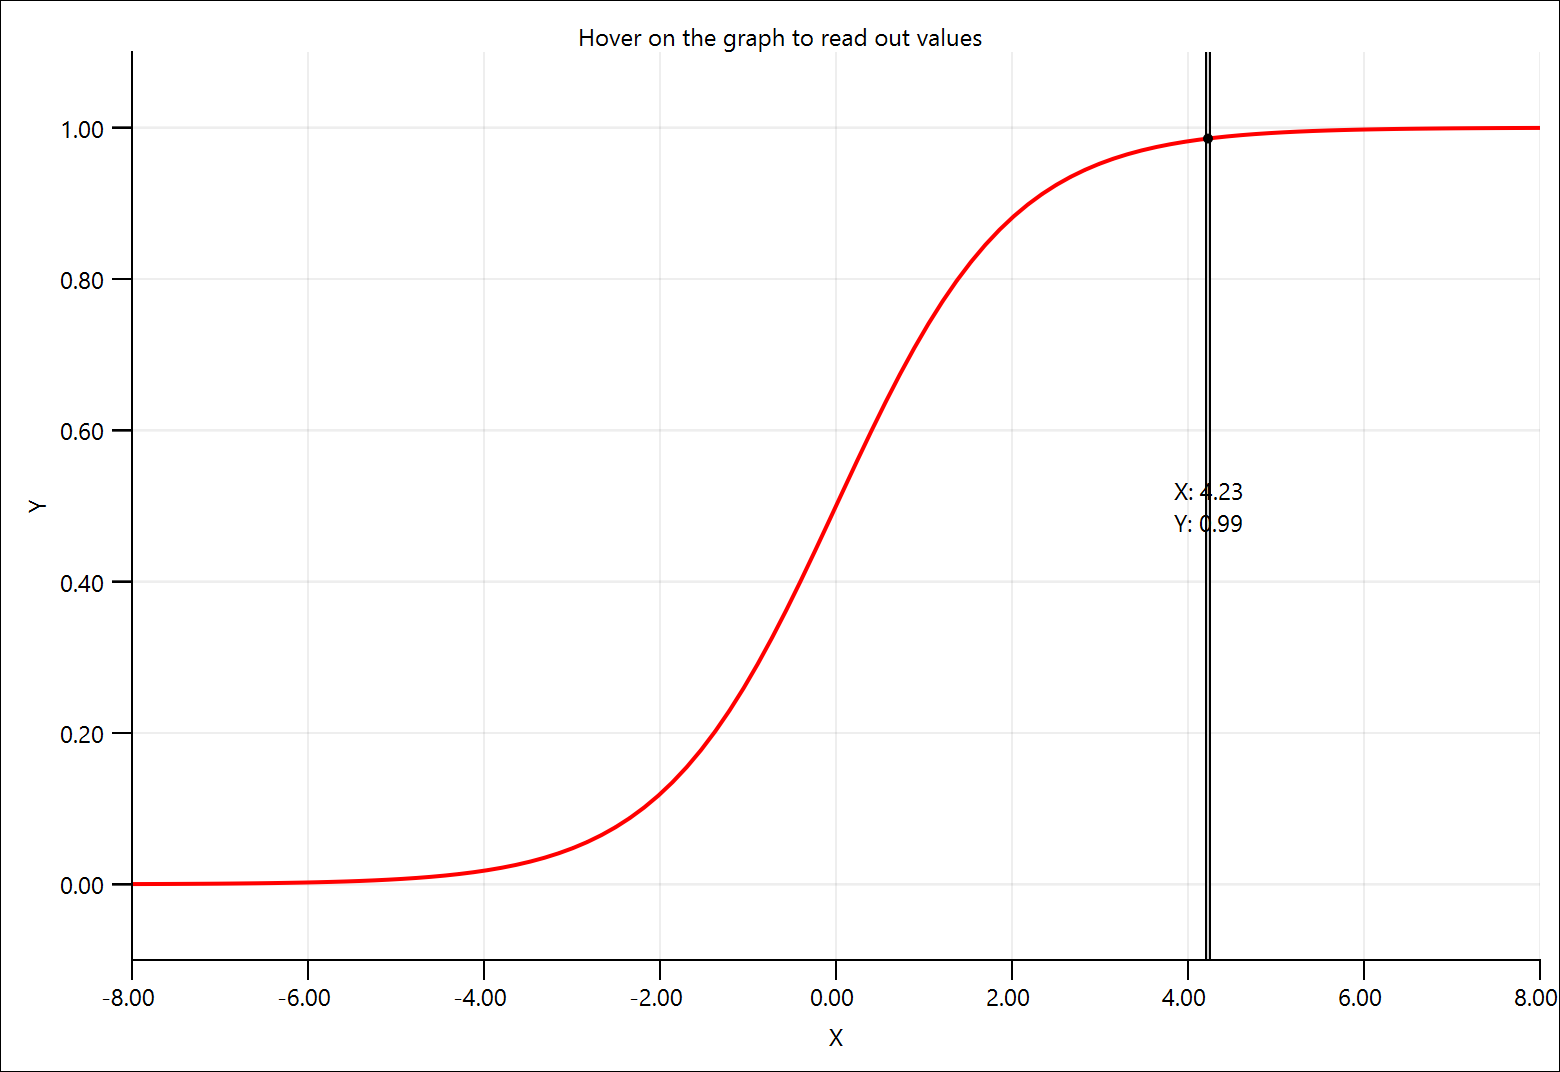
A graph with a movable line that shows the X and Y value at that position.

This example demonstrates using a MouseArea to track the user's mouse, and using the dataTransform to covert that into data coordinates. Since QML is declarative, parts of the graph can be easily updated to react to mouse movements.
 // SPDX-FileCopyrightText: Copyright (c) 2024 Refeyn Ltd and other QuickGraphLib contributors
 // SPDX-License-Identifier: MIT

 import QtQuick
 import QtQuick.Shapes as QQC
 import QuickGraphLib as QuickGraphLib
 import QuickGraphLib.GraphItems as QGLGraphItems
 import QuickGraphLib.PreFabs as QGLPreFabs

 QGLPreFabs.XYAxes {
     id: axes

     function f(x) {
         return 0.5 + 0.5 * Math.tanh(x / 2);
     }

     title: "Hover on the graph to read out values"
     viewRect: Qt.rect(-8, -0.1, 16, 1.2)
     xLabel: "X"
     yLabel: "Y"

     QGLGraphItems.Line {
         dataTransform: axes.dataTransform
         path: QuickGraphLib.Helpers.linspace(-8, 8, 100).map(x => Qt.point(x, axes.f(x)))
         strokeColor: "red"
         strokeWidth: 2
     }
     QGLGraphItems.AxVLine {
         id: line

         dataTransform: axes.dataTransform
         position: axes.dataTransform.inverted().map(Qt.point(mousearea.mouseX, mousearea.mouseY)).x
         strokeColor: "lightgrey"
         strokeStyle: QQC.ShapePath.DashLine
         viewRect: axes.viewRect
     }
     Text {
         text: "X: %1\nY: %2".arg(Number(line.position).toFixed(2)).arg(Number(axes.f(line.position)).toFixed(2))
         x: line.topLeftPoint.x - width / 2
         y: parent.height / 2 - height / 2
     }
     QGLGraphItems.Marker {
         color: "black"
         dataTransform: axes.dataTransform
         position: Qt.point(line.position, axes.f(line.position))
     }
     MouseArea {
         id: mousearea

         anchors.fill: parent
         hoverEnabled: true
     }
 }