Contours
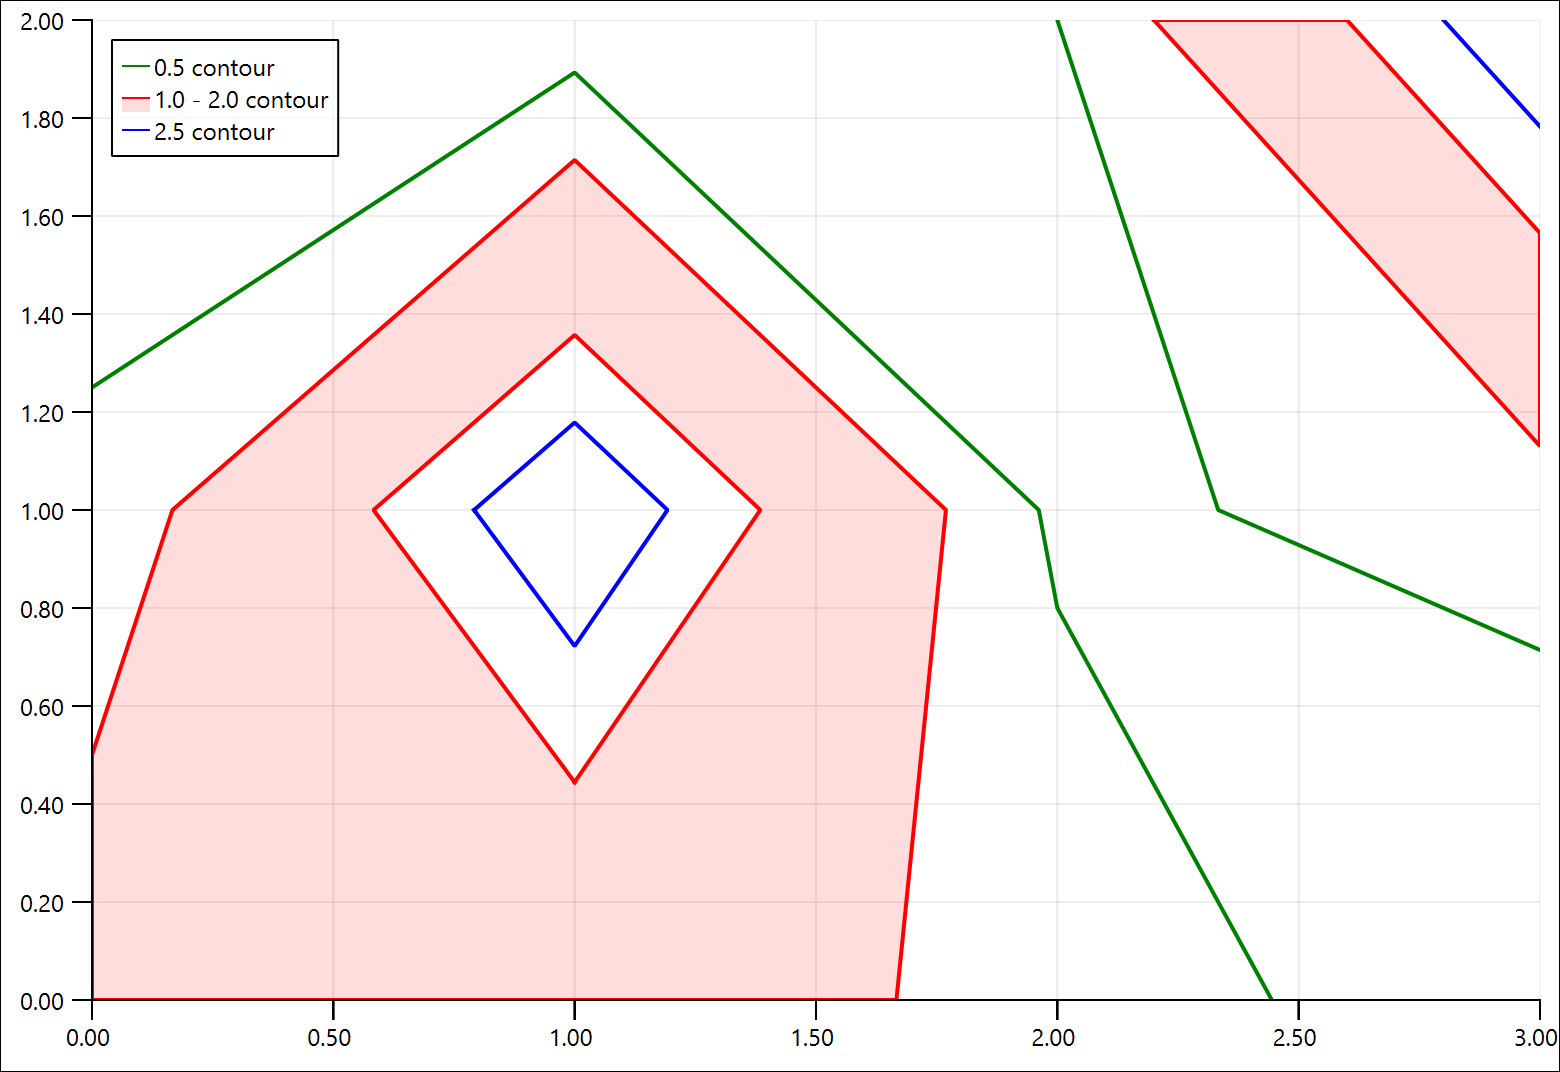
A graph with contour lines and fills.

This example demonstrates using the Python helpers to generate some contour lines (green and blue) and a contour fill (red area), which are then plotted using Contour.
The contourpy package must be installed to view this example. See https://contourpy.readthedocs.io/ for installation instructions and algorithm details.
 // SPDX-FileCopyrightText: Copyright (c) 2024 Refeyn Ltd and other QuickGraphLib contributors
 // SPDX-License-Identifier: MIT

 import QtQuick
 import QtQuick.Layouts as QQL
 import QuickGraphLib.GraphItems as QGLGraphItems
 import QuickGraphLib.PreFabs as QGLPreFabs
 import QuickGraphLib.PythonHelpers as QGLPyHelpers

 QQL.GridLayout {
     columnSpacing: 0
     columns: 2
     rowSpacing: 0

     QGLPreFabs.XYAxes {
         id: axes

         property var meshX: [[0, 1, 2, 3], [0, 1, 2, 3], [0, 1, 2, 3]]
         property var meshY: [[0, 0, 0, 0], [1, 1, 1, 1], [2, 2, 2, 2]]
         property var meshZ: [[1.4, 1.2, 0.9, 0], [0.6, 3, 0.4, 0.7], [0.2, 0.2, 0.5, 3]]

         QQL.Layout.fillHeight: true
         QQL.Layout.fillWidth: true
         viewRect: Qt.rect(0, 0, 3, 2)

         QGLGraphItems.Contour {
             id: fillC

             dataTransform: axes.dataTransform
             fillColor: "#22ff0000"
             paths: QGLPyHelpers.ContourHelper.contourFill(axes.meshX, axes.meshY, axes.meshZ, 1, 2)
             strokeColor: "red"
             strokeWidth: 2
         }
         QGLGraphItems.Contour {
             id: lowerLineC

             dataTransform: axes.dataTransform
             paths: QGLPyHelpers.ContourHelper.contourLine(axes.meshX, axes.meshY, axes.meshZ, 0.5)
             strokeColor: "green"
             strokeWidth: 2
         }
         QGLGraphItems.Contour {
             id: upperLineC

             dataTransform: axes.dataTransform
             paths: QGLPyHelpers.ContourHelper.contourLine(axes.meshX, axes.meshY, axes.meshZ, 2.5)
             strokeColor: "blue"
             strokeWidth: 2
         }
         QGLGraphItems.BasicLegend {
             anchors.left: parent.left
             anchors.margins: 10
             anchors.top: parent.top

             QGLGraphItems.BasicLegendItem {
                 strokeColor: lowerLineC.strokeColor
                 text: "0.5 contour"
             }
             QGLGraphItems.BasicLegendItem {
                 fillColor: fillC.fillColor
                 strokeColor: fillC.strokeColor
                 text: "1.0 - 2.0 contour"
             }
             QGLGraphItems.BasicLegendItem {
                 strokeColor: upperLineC.strokeColor
                 text: "2.5 contour"
             }
         }
     }
 }