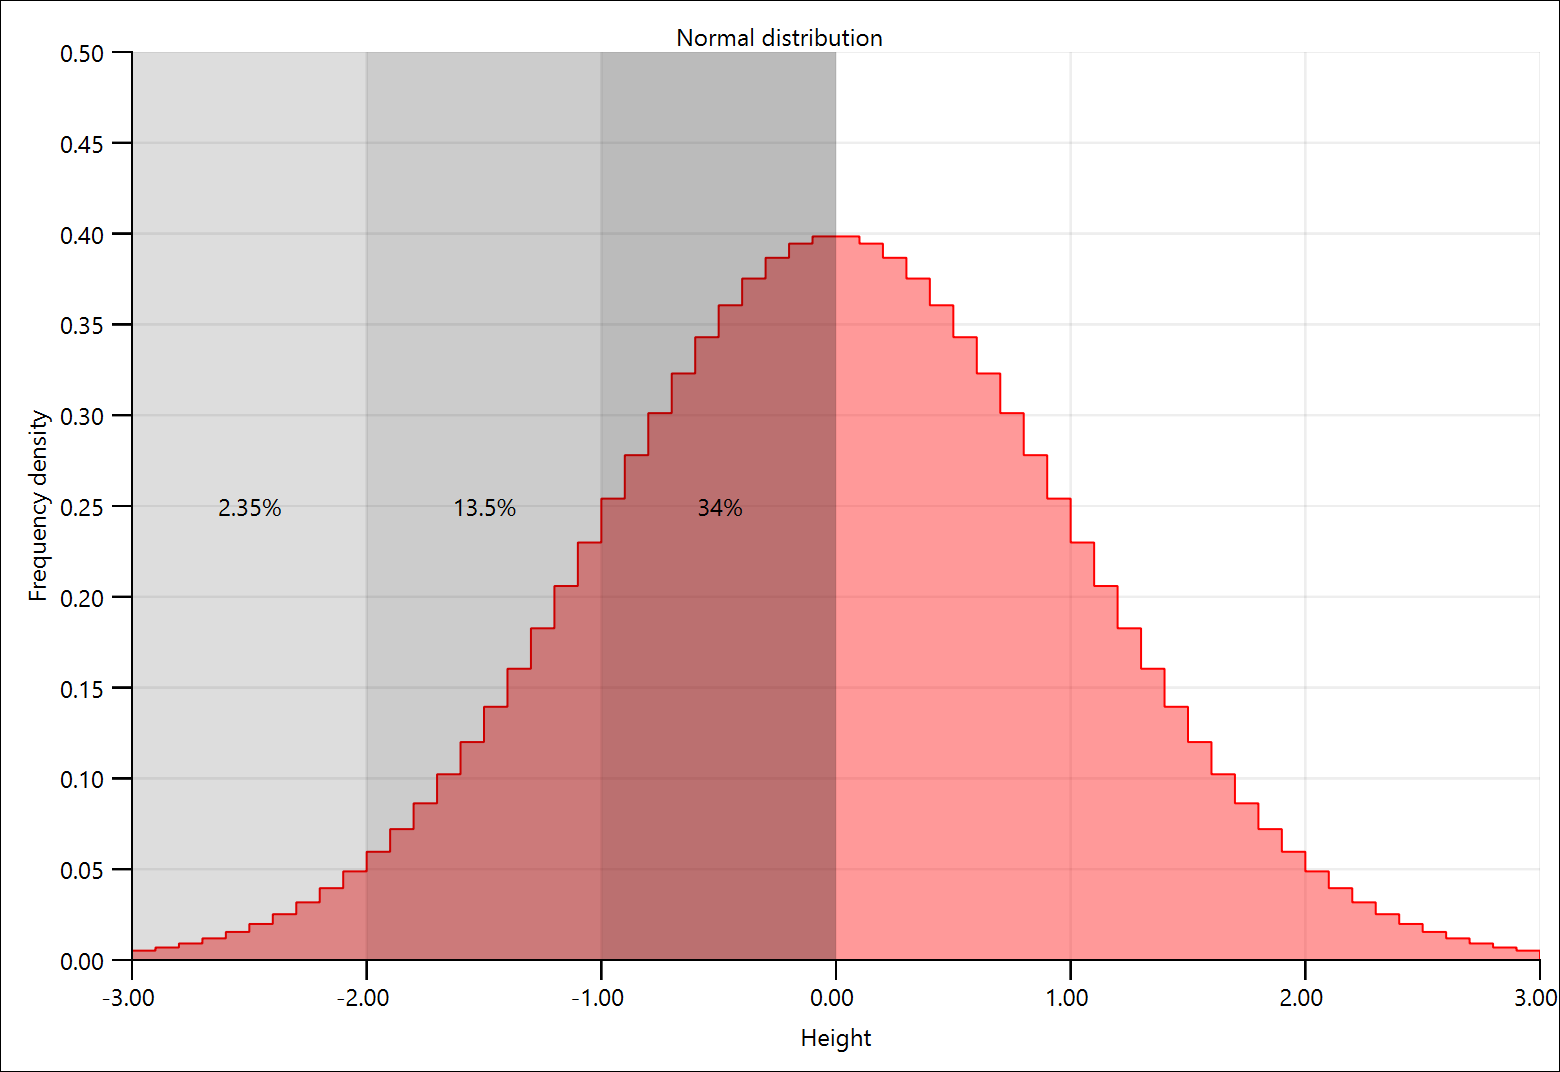
Basic histogram
A simple histogram of a normal function.

This example demonstrates using Histogram to display a normal distribution, along with some vertical spans. The spans are shown above the histogram as they are defined later on in the file. The Text items are not integrated into the rendering of the graph (as they are Items, not ShapePaths), and therefore are above everything. This is also the reason the Text items are positioned using the x and y properties, since anchors cannot be used in this case.
 // SPDX-FileCopyrightText: Copyright (c) 2024 Refeyn Ltd and other QuickGraphLib contributors
 // SPDX-License-Identifier: MIT

 import QtQuick
 import QuickGraphLib as QuickGraphLib
 import QuickGraphLib.GraphItems as QGLGraphItems
 import QuickGraphLib.PreFabs as QGLPreFabs

 QGLPreFabs.XYAxes {
     id: axes

     title: "Normal distribution"
     viewRect: Qt.rect(-3, 0, 6, 0.5)
     xLabel: "Height"
     yLabel: "Frequency density"

     QGLGraphItems.Histogram {
         bins: QuickGraphLib.Helpers.linspace(-3, 3, 61)
         dataTransform: axes.dataTransform
         fillColor: "#66ff0000"
         heights: QuickGraphLib.Helpers.range(0, bins.length - 1).map(i => (bins[i] + bins[i + 1]) / 2).map(x => Math.exp(-0.5 * x * x) / Math.sqrt(2 * Math.PI))
         strokeColor: "red"
         strokeWidth: 1
     }
     QGLGraphItems.AxVSpan {
         id: span34

         dataTransform: axes.dataTransform
         fillColor: "#44000000"
         viewRect: axes.viewRect
         xMax: 0
         xMin: -1
     }
     Text {
         text: "34%"
         x: (span34.topLeftPoint.x + span34.bottomRightPoint.x) / 2 - width / 2
         y: (span34.topLeftPoint.y + span34.bottomRightPoint.y) / 2 - height / 2
     }
     QGLGraphItems.AxVSpan {
         id: span13

         dataTransform: axes.dataTransform
         fillColor: "#33000000"
         viewRect: axes.viewRect
         xMax: -1
         xMin: -2
     }
     Text {
         text: "13.5%"
         x: (span13.topLeftPoint.x + span13.bottomRightPoint.x) / 2 - width / 2
         y: (span13.topLeftPoint.y + span13.bottomRightPoint.y) / 2 - height / 2
     }
     QGLGraphItems.AxVSpan {
         id: span2

         dataTransform: axes.dataTransform
         fillColor: "#22000000"
         viewRect: axes.viewRect
         xMax: -2
         xMin: -3
     }
     Text {
         text: "2.35%"
         x: (span2.topLeftPoint.x + span2.bottomRightPoint.x) / 2 - width / 2
         y: (span2.topLeftPoint.y + span2.bottomRightPoint.y) / 2 - height / 2
     }
 }