Horizontal bar chart
A simple horizontal bar chart.
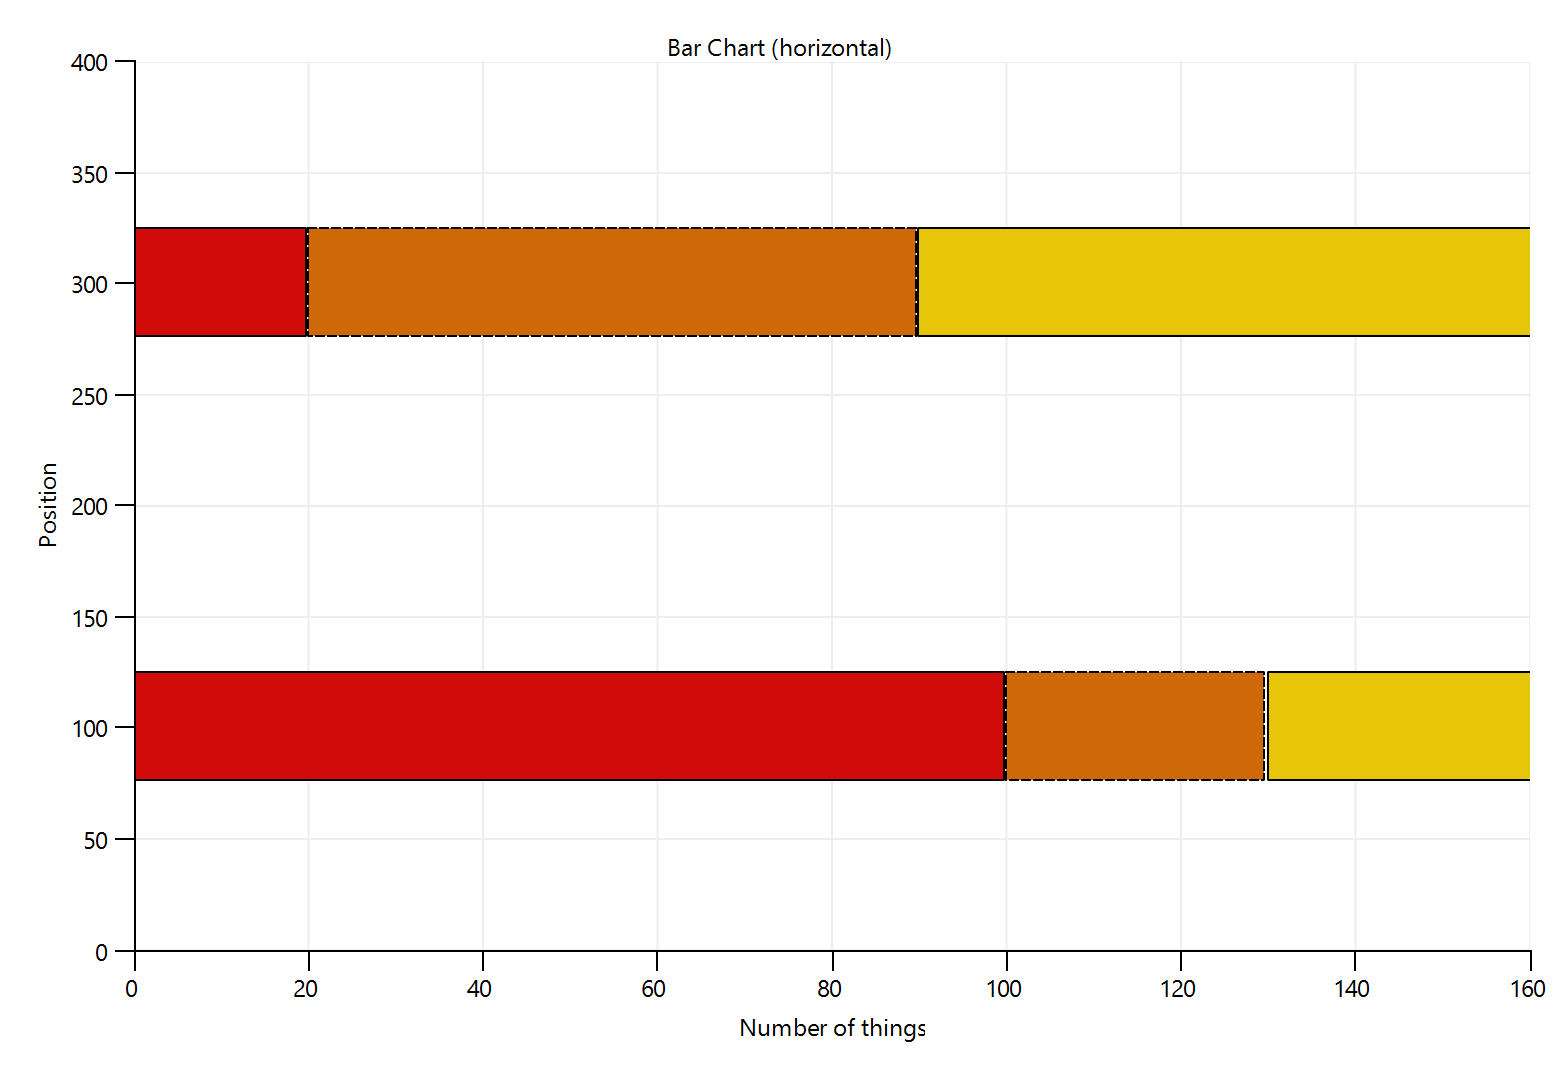
 // SPDX-FileCopyrightText: Copyright (c) 2024 Refeyn Ltd and other QuickGraphLib contributors
 // SPDX-License-Identifier: MIT

 import QtQuick
 import QtQuick.Shapes as QQS
 import QuickGraphLib as QuickGraphLib
 import QuickGraphLib.GraphItems as QGLGraphItems
 import QuickGraphLib.PreFabs as QGLPreFabs

 QGLPreFabs.XYAxes {
     id: axes

     title: "Bar Chart (horizontal)"
     viewRect: Qt.rect(0, 0, 160, 400)
     xAxis.decimalPoints: 0
     xLabel: "Number of things"
     yAxis.decimalPoints: 0
     yLabel: "Position"

     QGLGraphItems.BarHorizontal {
         barHeight: 50
         barLength: 100
         dataTransform: axes.dataTransform
         fillColor: '#d10a0a'
         position: 100
         strokeColor: "black"
         strokeWidth: 1
     }
     QGLGraphItems.BarHorizontal {
         barHeight: 50
         barLength: 30
         dataTransform: axes.dataTransform
         fillColor: '#cf6808'
         position: 100
         strokeColor: "black"
         strokeStyle: QQS.ShapePath.DashLine
         strokeWidth: 1
         xStart: 100
     }
     QGLGraphItems.BarHorizontal {
         barHeight: 50
         barLength: 50
         dataTransform: axes.dataTransform
         fillColor: '#e7c609'
         position: 100
         strokeColor: "black"
         strokeWidth: 1
         xStart: 130
     }
     QGLGraphItems.BarHorizontal {
         barHeight: 50
         barLength: 20
         dataTransform: axes.dataTransform
         fillColor: '#d10a0a'
         position: 300
         strokeColor: "black"
         strokeWidth: 1
     }
     QGLGraphItems.BarHorizontal {
         barHeight: 50
         barLength: 70
         dataTransform: axes.dataTransform
         fillColor: '#cf6808'
         position: 300
         strokeColor: "black"
         strokeStyle: QQS.ShapePath.DashLine
         strokeWidth: 1
         xStart: 20
     }
     QGLGraphItems.BarHorizontal {
         barHeight: 50
         barLength: 150
         dataTransform: axes.dataTransform
         fillColor: '#e7c609'
         position: 300
         strokeColor: "black"
         strokeWidth: 1
         xStart: 90
     }
 }